Last updated: 16 October 2026 · By G&M Rides
An estimated 32.3 million passenger trips to London's five main airports ended with a booked or hired car in 2025. Booked and hired cars include minicabs, private hire cars, ride-hailing apps and black cabs. That is about 1 million more trips than in 2024. At Heathrow they are now the single most common way to arrive, ahead of both the Tube and being dropped off by friends or family.
We gathered 60 statistics from official sources: the Civil Aviation Authority (CAA), the Department for Transport (DfT), Transport for London (TfL), and Heathrow, Gatwick and Luton airports. The newest full year of data is 2025, and licensing data runs to April 2026. Where no official count exists, such as the number of minicab trips to each airport, we worked out our own estimate from the official tables. The method is explained at the end.
Key London airport transfer statistics at a glance
- 31.2% of Heathrow's terminating passengers arrived by booked or hired car in 2025, the most popular way to reach the airport (CAA, 2025).
- ~32.3 million passenger trips used a booked or hired car across the five London airports in 2025, up ~1.0 million (3.2%) on 2024 (G&M Rides analysis of CAA data).
- Luton saw the biggest jump: the booked and hired car share rose from 15.3% to 19.3% in a single year (CAA, 2025).
- London has 93,300 licensed private hire vehicles and only 13,700 black cabs. Private hire cars make up ~87% of the city's licensed for-hire fleet (DfT, April 2026).
- Being dropped off at a Heathrow terminal costs £7 in 2026 (DfT, 2026).
Contents
- How passengers reach London airports (2025)
- How many airport trips use a minicab or private hire car?
- London airport passenger numbers and catchments
- Who books an airport transfer: passenger profiles
- London minicab and private hire licensing statistics (2026)
- Drop-off charges, rail competition and airport policy
- Sustainability and the future of airport transport
- What these statistics mean if you're booking a transfer
- Methodology and data notes
- FAQs
- Sources
How passengers reach London airports (2025)
The CAA Departing Passenger Survey is the official measure that airports, the DfT and planning inspectors use to track how people get to the airport. It records each passenger's "last surface mode", meaning the last form of ground transport they used before reaching the terminal. The CAA's for-hire car category puts minicabs, private hire, ride-hailing apps and black cabs together, so the figures below describe the whole booked and hired car market, not private hire alone.
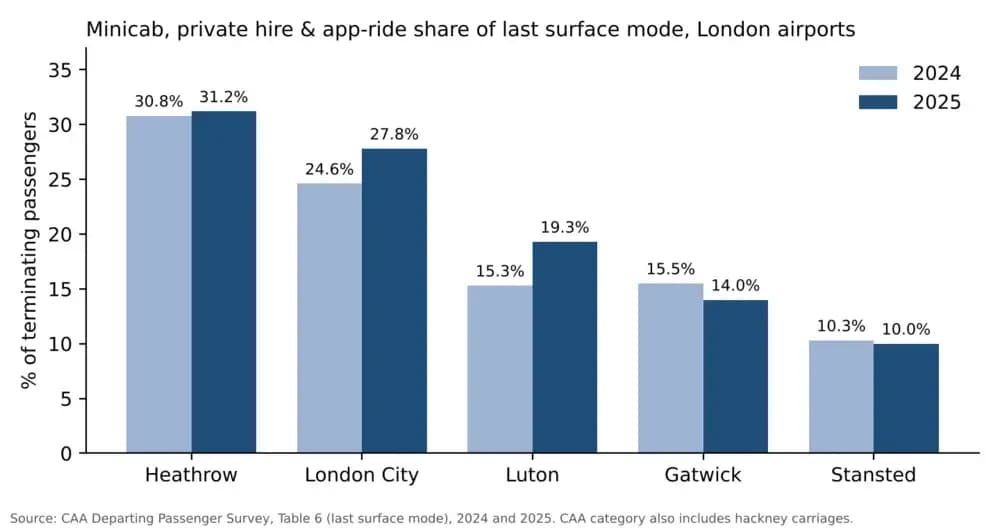
Chart 1: Booked and hired car share of passengers' last ground journey to London airports, 2024 vs 2025. Data: CAA Departing Passenger Survey, Table 6. Free to embed with credit to G&M Rides and the CAA.
Heathrow
- 31.2% of Heathrow's terminating passengers made the last leg of their journey to the airport by booked or hired car in 2025. That is almost one in three. (CAA Passenger Survey 2025, Table 6)
- The figure rose from 30.8% in 2024, an increase of 0.4 percentage points. (CAA 2024, Table 6; CAA 2025, Table 6)
- Booked and hired cars were Heathrow's single largest access mode in 2025, ahead of the London Underground at 27.2%. (CAA 2025, Table 6)
- Only 24.7% of Heathrow passengers arrived by private car, so booked transfers beat friends-and-family drop-offs by 6.5 points. (CAA 2025, Table 6)
London City
- 27.8% of London City Airport's terminating passengers arrived by booked or hired car in 2025, the second-highest share of the five London airports. (CAA 2025, Table 6)
- That was up from 24.6% in 2024, a rise of 3.2 percentage points in one year. (CAA 2024, Table 6)
Luton
- 19.3% of Luton Airport's terminating passengers arrived by booked or hired car in 2025, up from 15.3% in 2024. (CAA 2025, Table 6; CAA 2024, Table 6)
- That 4.0-point rise was the largest year-on-year increase at any London airport. (G&M Rides analysis of CAA Table 6, 2024 and 2025)
- Over the same period, private car use at Luton fell from 54.1% to 45.6%, a drop of 8.5 points. (CAA 2025, Table 6; CAA 2024, Table 6)
Gatwick
- 14.0% of Gatwick's terminating passengers arrived by booked or hired car in 2025, down from 15.5% in 2024. (CAA 2025, Table 6; CAA 2024, Table 6)
- 38.7% of Gatwick passengers arrived by rail, which makes them 2.8 times more likely to take the train than a booked or hired car. Rail is Gatwick's biggest competitor to road transfers. (CAA 2025, Table 6)
Stansted
- 10.0% of Stansted's terminating passengers arrived by booked or hired car in 2025, the lowest share of the five London airports. It was 10.3% in 2024. (CAA 2025, Table 6; CAA 2024, Table 6)
National picture
- 62% of passengers at the eight English airports in the CAA survey used private modes (car, booked or hired car, or hire car) to reach the airport in 2025. (CAA Survey Dashboard 2025)
- The remaining 38% used public transport. (CAA Survey Dashboard 2025)
| Airport | 2024 share | 2025 share | Change (pts) |
|---|---|---|---|
| Heathrow | 30.8% | 31.2% | +0.4 |
| London City | 24.6% | 27.8% | +3.2 |
| Luton | 15.3% | 19.3% | +4.0 |
| Gatwick | 15.5% | 14.0% | −1.5 |
| Stansted | 10.3% | 10.0% | −0.3 |
Booked and hired car share of terminating passengers' last surface mode. Source: CAA Departing Passenger Survey, Table 6.
How many airport trips use a minicab or private hire car?

No public dataset counts airport minicab journeys directly. To estimate them, we multiplied the CAA's 2025 terminating passenger totals for each airport by that airport's booked and hired car share from the same survey. These are G&M Rides estimates, not official counts. The full method is in the methodology section.
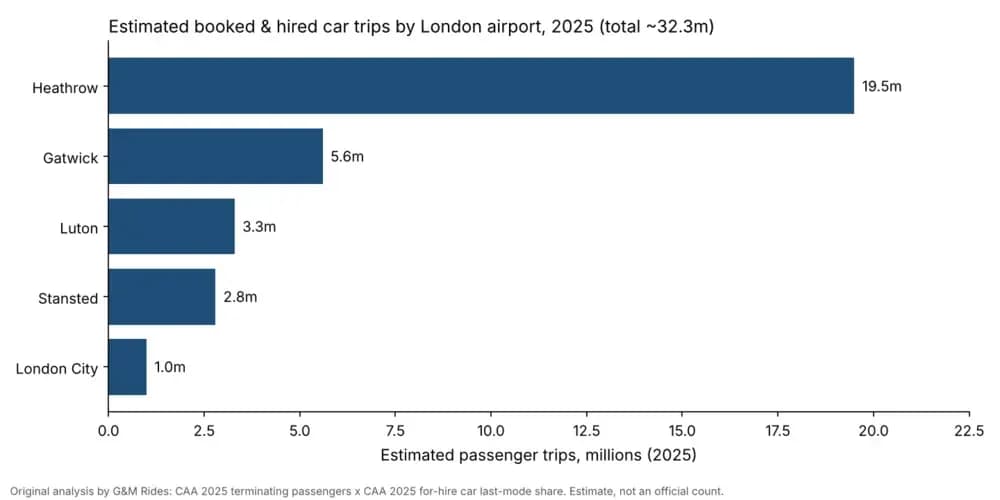
Chart 2: Estimated booked and hired car passenger trips by London airport, 2025. Original analysis by G&M Rides using CAA data. Free to embed with credit.
- An estimated 32.3 million terminating passenger trips at the five London airports used a booked or hired car as their last ground journey in 2025. (G&M Rides analysis of CAA 2025, Table 6)
- That is about 1.0 million more than in 2024, growth of roughly 3.2% in a year. (G&M Rides analysis of CAA 2024 and 2025 data)
- An estimated 19.5 million of those trips were to Heathrow. (CAA 2025, Table 6, derived)
- Heathrow alone accounts for about 60% of all estimated booked and hired car trips to London airports. (G&M Rides analysis)
- Gatwick generated an estimated 5.6 million booked and hired car trips in 2025. (G&M Rides analysis of CAA data)
- Stansted generated an estimated 2.8 million, and London City about 1.0 million. (G&M Rides analysis of CAA data)
- Booked and hired car trips at Luton rose from about 2.5 million in 2024 to about 3.3 million in 2025. (G&M Rides analysis of CAA 2024 and 2025 data)
- That is growth of roughly 31% in a single year, the fastest of any London airport. (G&M Rides analysis)
| Airport | Estimated trips, 2025 | Share of London total |
|---|---|---|
| Heathrow | ~19.5m | ~60% |
| Gatwick | ~5.6m | ~17% |
| Luton | ~3.3m | ~10% |
| Stansted | ~2.8m | ~9% |
| London City | ~1.0m | ~3% |
| Total | ~32.3m | 100% |
Figures are rounded, so the airport estimates may not add up exactly to the total.
London airport passenger numbers and catchments
- The five London airports in the CAA survey handled about 176.7 million passengers in 2025. (CAA Passenger Survey 2025, Table 1)
- Heathrow handled 84.2 million of them, almost half the London total. (CAA 2025, Table 1)
- Gatwick handled 42.2 million passengers. (CAA 2025, Table 1)
- Stansted handled 29.4 million passengers. (CAA 2025, Table 1)
- Luton handled 17.1 million passengers. (CAA 2025, Table 1)
- London City handled 3.7 million passengers. (CAA 2025, Table 1)
- 25.8% of Heathrow passengers were connecting between flights, so they made no ground journey at all. This is why Heathrow's ground transport market is much smaller than its headline passenger number. (CAA 2025, Table 1)
- Gatwick handled 42,644,253 non-transfer passengers in 2025, according to its independently verified monitoring report. (Gatwick S106 Annual Monitoring Report 2025)
- That was about 1% lower than 2024's 43,091,701, or roughly 447,000 fewer passengers. (Gatwick S106 Report 2025)
- More than 61 million passengers used ground transport to reach Heathrow in 2024. (DfT, Strategic Vision for Transport to an Expanded Heathrow, 2026)
- More than 50% of ground journeys to Heathrow started in London. (DfT Strategic Vision, 2026)
- Berkshire, Hampshire and Surrey each generated more than 2 million passenger trips a year to Heathrow by ground transport. Direct rail links from much of these counties are limited. (DfT Strategic Vision, 2026)
Who books an airport transfer: passenger profiles
- 53.0% of Heathrow's terminating passengers were travelling alone in 2025. (CAA Passenger Survey 2025, Table 7)
- 66.3% of London City's terminating passengers were travelling alone, the highest share of any airport in the survey. (CAA 2025, Table 7)
- 45.7% of Gatwick's terminating passengers were travelling with one other person, which reflects its strong holiday and couples market. (CAA 2025, Table 7)
- 9.0% of Luton's terminating passengers travelled in groups of four, more than at any other London airport. See the data note on this figure below. (CAA 2025, Table 7)
- About 40.3% of London City's scheduled terminating passengers were travelling on business in 2025. (CAA Passenger Survey 2025, Table 3, derived)
- At Heathrow, only about 18.6% were business travellers. (CAA 2025, Table 3, derived)
- Leisure travellers who live outside the UK made up 31.9% of Heathrow's scheduled terminating passengers in 2025, about 20 million people. (CAA 2025, Table 3)
Why it matters: London City is a solo, business-led airport, which fits its high booked-car share. Gatwick and Luton have more couples and groups, so vehicle size counts for more there: luggage space for two, or an MPV for a family of four.
London minicab and private hire licensing statistics (2026)
The DfT's licensing figures are rounded to the nearest 100 and are a snapshot taken on 1 April 2026.
- London had 93,300 licensed private hire vehicles on 1 April 2026, up 1% since 2024. (DfT, Private hire and hackney carriage statistics, England: 2026)
- London had 13,700 licensed black cabs (hackney carriages), down 7% since 2024. (DfT, 2026)
- Private hire vehicles made up about 87% of London's 107,000 licensed for-hire vehicles. (G&M Rides analysis of DfT, 2026)
- London had 104,900 private-hire-only driver licences, down 1%. (DfT, 2026)
- London had 16,000 black-cab-only driver licences, down 8%. (DfT, 2026)
- Only about 400 of London's licensed private hire vehicles were wheelchair accessible, down 10% since 2024. That is fewer than 1 in 200 vehicles. (DfT, 2026)
- London had about 1,800 licensed private hire operators, up 6% since 2024. More firms are now competing for airport work. (DfT, 2026)
- The number of licensed black-cab drivers in London fell 24.5%, from 22,409 in March 2020 to 16,919 in December 2024. (TfL Finance Committee, Feb 2025, Appendix 4)
- London had 107,884 licensed private hire drivers in December 2024, only 3.3% fewer than in March 2020. Private hire has largely recovered from the pandemic. (TfL Finance Committee, 2025)
- TfL's private hire driver licence application fee rose from £124 to £138 on 1 June 2026, an increase of about 11%. (TfL Notice 05/26)
Note on ride-hailing apps: the DfT states that its statistics cannot separate drivers who work through app-based platforms from other private hire drivers. No official figure exists for "Uber cars in London" or for app-booked airport trips.
Drop-off charges, rail competition and airport policy
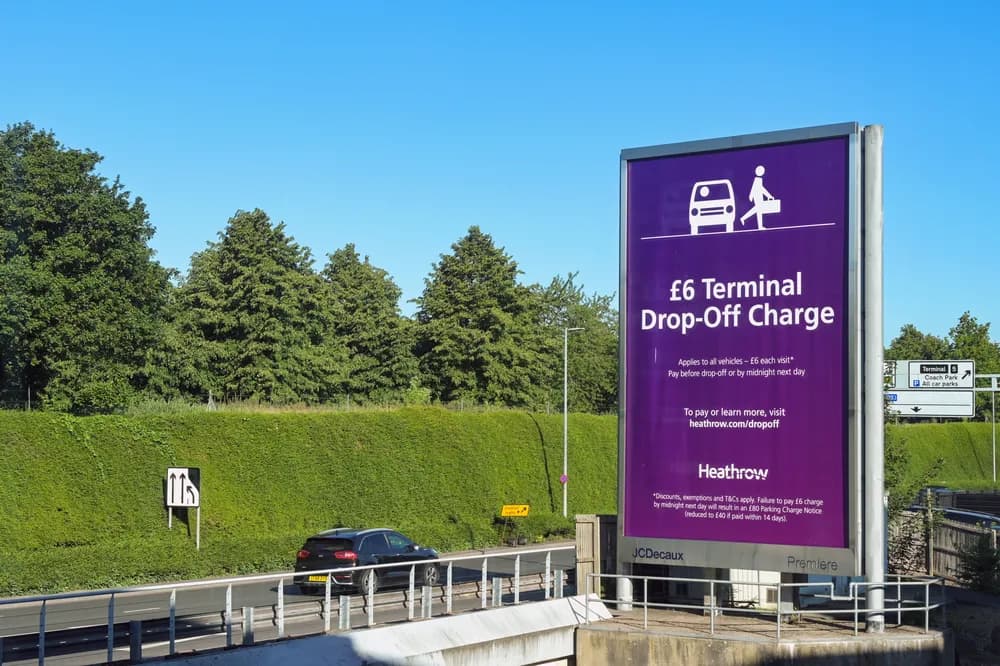
- Being dropped off at a Heathrow terminal costs £7 in 2026. (DfT Strategic Vision, 2026)
- The DfT puts Heathrow's public transport mode share at 42% of passengers. (DfT Strategic Vision, 2026)
- Heathrow's own passenger survey (Profiler) puts public transport share at 46%, more than 5 percentage points higher than in 2019. (Heathrow letter to the London Assembly, Oct 2025)
- Heathrow offers up to 25 trains per hour to London. (Heathrow letter to the London Assembly, 2025)
- Provisional CAA data puts Gatwick's public transport mode share at 42.8% in 2025, while Gatwick's own survey recorded 50.5%. The two surveys differ by 7.7 points. (Gatwick S106 Report 2025)
- 21.2 million passengers used Gatwick Airport railway station between April 2024 and March 2025, up 8.7% year on year. (Gatwick S106 Report 2025)
- Gatwick had 42,042 public parking spaces in September 2025, and 75% of them were occupied, around 31,500 cars. (Gatwick S106 Report 2025)
In its 2026 strategy, the DfT also lists higher terminal drop-off charges and more "backfilled" private hire and black-cab journeys among its options for managing road demand at Heathrow. Backfilling means drivers pick up a return passenger instead of driving away empty. The same document says private hire and black-cab trips "will remain an important means of access" to Heathrow, especially for passengers with accessibility needs. (DfT Strategic Vision, 2026)
Sustainability and the future of airport transport
- Under the draft Heathrow Expansion National Policy Statement, Heathrow would need at least 50% public transport mode share at 116 million passengers of capacity, and 55% at 130 million. (DfT Strategic Vision, 2026)
- Expansion would add about 65 million passenger journeys a year, taking Heathrow to around 150 million passengers by the mid-2050s. (DfT Strategic Vision, 2026)
- Passenger journeys to and from Luton Airport account for more than 45% of the airport's total carbon footprint. (London Luton Airport Surface Access Strategy 2024–2028)
- Luton aims to cut passenger car journeys to 40% and reach 47% sustainable journeys by 2028. (Luton Surface Access Strategy)
What these statistics mean if you're booking a transfer
- Booked cars are now mainstream at Heathrow, London City and Luton. Almost one in three Heathrow passengers arrives this way, so pre-booking is a normal choice, not a luxury.
- Drop-off charges add up. Heathrow charges £7 just to stop at the terminal, and the government lists higher charges as a policy option. When you compare a lift from a friend with a booked transfer, ask whether your quote already covers the drop-off charge.
- Rail is strongest at Gatwick. Gatwick passengers are 2.8 times more likely to arrive by train than by booked car. A transfer makes most sense when you have heavy luggage, travel as a group or family, need an early or late pickup, or start from somewhere without a direct rail link. Surrey, Berkshire and Hampshire each send more than 2 million trips a year to Heathrow by road.
- Vehicle size matters. Most Heathrow and London City travellers fly alone, but couples and groups are common at Gatwick and Luton. Book a car that fits your party and your luggage.
- Accessible vehicles are scarce. With only about 400 wheelchair-accessible private hire vehicles in London, book early if you need one.
About G&M Rides: G&M Rides is a London airport transfer service for Heathrow, Gatwick, Stansted, Luton and London City. You get a price quote when you book. According to the company, all journeys are driven by drivers from its sister company, G&M Direct Hire, a London PCO car hire firm in the same group. G&M Rides does not subcontract to outside drivers. Get a quote.
Methodology and data notes
- How we estimated airport transfer trips (statistics 15–22). For each airport, we multiplied the CAA's 2025 terminating passenger total (all passengers minus those connecting between flights, from Table 1) by that airport's booked and hired car share of last surface mode (Table 6). The 2024 figures use the same method with the 2024 tables. The results are rounded estimates, not official counts.
- What "booked or hired car" means here. The CAA records minicabs, private hire, ride-hailing apps and black cabs as one category. These figures therefore cover the whole for-hire car market, not private hire on its own.
- One-way assumption. The CAA survey weights departing and arriving journeys on the assumption that passengers use the same mode in both directions (Gatwick S106 Report 2025). The real split between arrivals and departures may be different.
- CAA vs airport surveys. Airports run their own "Profiler" surveys, which can give quite different results. At Gatwick, the 2025 public transport figure was 7.7 points higher in Gatwick's survey than in the CAA's. Heathrow's 46% is higher than the DfT's 42%. We always name the survey we quote.
- Provisional and flagged figures.
- Gatwick's 2025 CAA figures were provisional at the time of Gatwick's monitoring report, because the airport was still resolving discrepancies with the CAA.
- In CAA Table 7, the Luton and Manchester "all passengers" columns are identical, which may be a publication error. Treat the Luton group-of-four figure (statistic 38) with caution.
- Rounding. DfT London licensing figures are rounded to the nearest 100. TfL driver counts are December 2024 snapshots from a weekly series.
- Drop-off charges at other airports. We found 2026 drop-off charges for Gatwick, Stansted, Luton and London City only in news articles, not in primary documents, so we have not included them. Check each airport's official drop-off page for current prices.
FAQs
How many people use a minicab or private hire car to get to London airports?
We estimate that about 32.3 million passenger trips to Heathrow, Gatwick, Stansted, Luton and London City ended with a booked or hired car in 2025. This is our analysis of CAA survey data, and it covers minicabs, private hire, ride-hailing apps and black cabs.
What is the most popular way to get to Heathrow?
Booked and hired cars, at 31.2% of terminating passengers in 2025. The London Underground was second at 27.2%, and private car drop-offs were third at 24.7% (CAA, 2025).
Which London airport has the fastest-growing demand for transfers?
Luton. The booked and hired car share rose from 15.3% to 19.3% between 2024 and 2025, and the estimated number of trips grew by about 31%.
How many private hire vehicles are licensed in London?
There were 93,300 licensed private hire vehicles on 1 April 2026, compared with 13,700 black cabs (DfT, 2026).
Is there official data on Uber airport trips in London?
No. The DfT says its statistics cannot separate app-based drivers from other private hire drivers, and no public document gives Uber's London airport trip volumes.
How much is the Heathrow drop-off charge?
£7 per terminal drop-off in 2026 (DfT, 2026).
Sources
- Civil Aviation Authority, Departing Passenger Survey 2025, Table 6: Last surface mode. PDF · Excel
- Civil Aviation Authority, Departing Passenger Survey 2024, Table 6: Last surface mode. PDF
- Civil Aviation Authority, Departing Passenger Survey 2025, Table 1: Types of passengers. PDF
- Civil Aviation Authority, Departing Passenger Survey 2025, Table 3: Characteristics of scheduled terminating passengers. PDF
- Civil Aviation Authority, Departing Passenger Survey 2025, Table 7: Group size of terminating air travellers. PDF
- Civil Aviation Authority, Passenger Survey Report Summary 2025 (dashboard). PDF
- Department for Transport, private hire and hackney carriage vehicle statistics, England: 2026 (data at 1 April 2026). gov.uk release
- Department for Transport, A Strategic Vision for Transport to an Expanded Heathrow Airport (June 2026). PDF
- Gatwick Airport Ltd, Section 106 Annual Monitoring Report 2025 (issued 3 August 2026). PDF
- Heathrow Airport Ltd, letter to the London Assembly Transport Committee (14 October 2025), Appendix 4. PDF
- Transport for London, Finance Committee (26 February 2025), Item 9e Appendix 4: licensed driver figures. PDF
- Transport for London, London Private Hire Notice 05/26: licence fees. PDF
- London Luton Airport, Airport Surface Access Strategy 2024–2028. PDF
You're welcome to cite these statistics and embed the charts. Please credit G&M Rides and link to this page. For the original-analysis figures, also credit the CAA as the data source.